 English
 Русский
 Português
 Español
 Հայերենով
 Türkçe
 Български
 中文
中文 ქართული
 Français
The "Project Tracking" section is used for effective management and monitoring of projects and tasks. It contains the following features:
- Project Planning:
- Option to add new projects, assign managers, and set project deadlines.
- Option to specify project details with epics and tasks, assign people responsible for each task.
- Option to set priorities and deadlines for tasks.
- Monitoring project execution and tracking progress:
- Key metrics, such as total time on projects, number of projects in work, cost, and productivity.
- Visualization of project progress using charts and graphs.
- Monitoring of ongoing tasks and their status.
- Tracking the time spent on each task and the entire project.
- Monitoring of project costs for budget management and cost optimization.
- Graphic reports:
- Time Tracking.
The report that tracks the time spent by employees on various tasks and projects. - Workload
The report that displays the workload intensity level of employees. - Web Pages and Applications
The report that shows the utilization of web pages and applications by employees. - Productivity
The report that assesses time spent based on the type of productivity. - Attention Focus
The report that displays the allocation of time on each project. - Budget
The report that shows the financial costs and revenues of projects.
- Time Tracking.
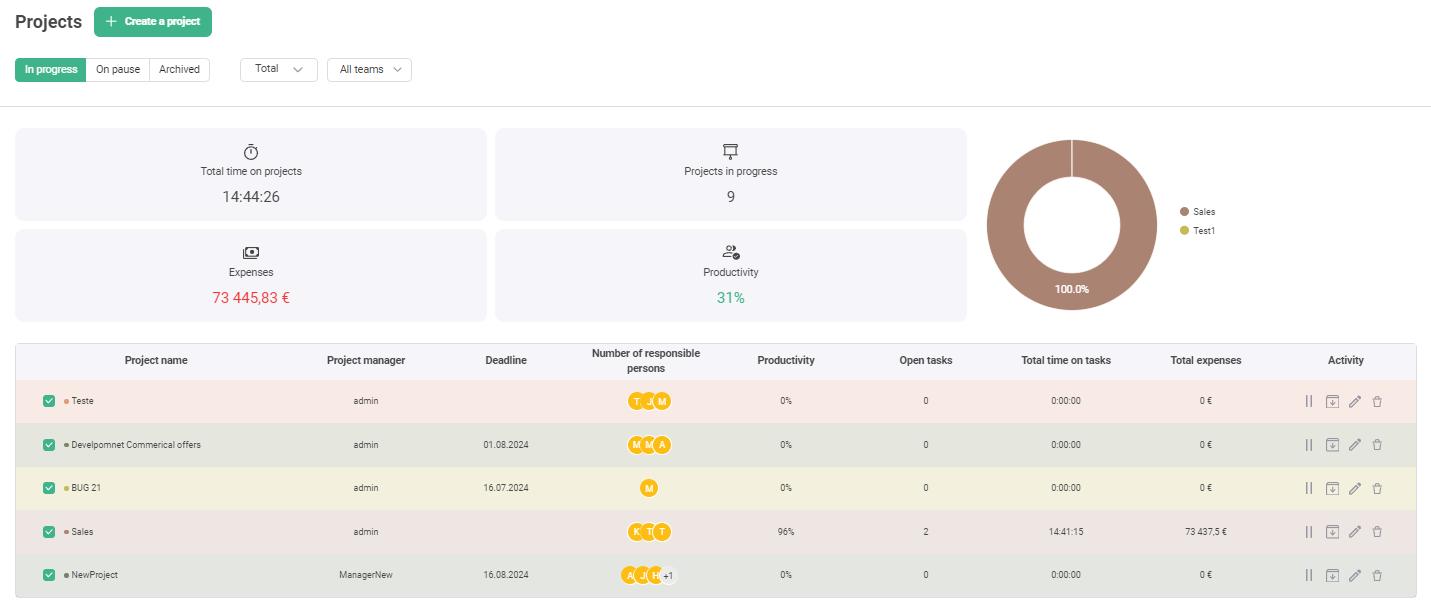
The homepage of the section contains information on all created projects and includes the option to create a new project.
The list of projects can be filtered using the following settings:
- Filtering by status:
Click on the relevant tab (for example, "In Progress") to filter projects by their status.
A project can be:- In Progress
- On Pause
- Archived
- Filtering by time:
Select a time range from the drop-down list to filter projects by date.- All time
- Last day
- Last month
- Custom period
- Filtering by team:
Select a team from the drop-down list to display the projects related to that team.- All teams
- Team (or department)
The following statistics are available for the selected projects
- Total time on projects:
Shows the total time spent on the projects. - Costs:
Shows the total expenses for the projects. - Projects in Progress:
Shows the total number of projects selected. - Productivity:
Shows the average percentage of productivity in the selected projects. - Pie Chart:
Shows the breakdown of the costs spent on the different projects. A legend on the right side of the chart shows the colors that correspond to each project – all projects are marked with different colors to visualize their proportion of the total. Hovering the mouse cursor over a sector pops up a tooltip with the costs of a particular project.
The projects table contains the following columns:
- Project name
Click on the name to open detailed information about the project. - Project manager
The manager responsible for the project. - Deadline
The date by which the project is to be completed. - Number of people responsible
The number of employees assigned to the project. - Productivity
- Ongoing tasks
The number of tasks that have not yet been completed. - Total time on tasks
Total time spent on project tasks. - Total costs
Total project costs in the selected currency. - Actions
Buttons for quick operations with the project:- Pause
- Archive
- Edit
- Delete
You can use the checkboxes next to the project names to select only those projects for which you want to get statistics. Using the pagination settings at the bottom of the table, you can select the number of rows displayed in the table and jump to other pages.
To select one or several projects from the full list of projects:
- In the projects table, use the checkboxes to select only those projects for which you want to see statistics
- All statistics will be recalculated for the selected projects
Graphic reports
Graphs help you instantly see the progress, problem areas and achievements of selected projects. They are recalculated automatically when you change selections.
Time tracking
The charts help you instantly see the development progress, problem areas and achievements of the selected projects. They are recalculated automatically when you change selections.
This report shows the time employees spend working on tasks in selected projects. The time spent on a project is presented on the chart, grouped by the selected period.
The time period can be set in:
- Days
- Weeks
- Months
- Quarters
You can activate a time change trend line for the report, which indicates how the project turnaround time changes over time.
Workload
This report shows how much time each employee spends on tasks in projects, thus helping to assess their current workload and efficiency. Based on the data from this report, you can reallocate tasks and improve workflows to increase team efficiency.
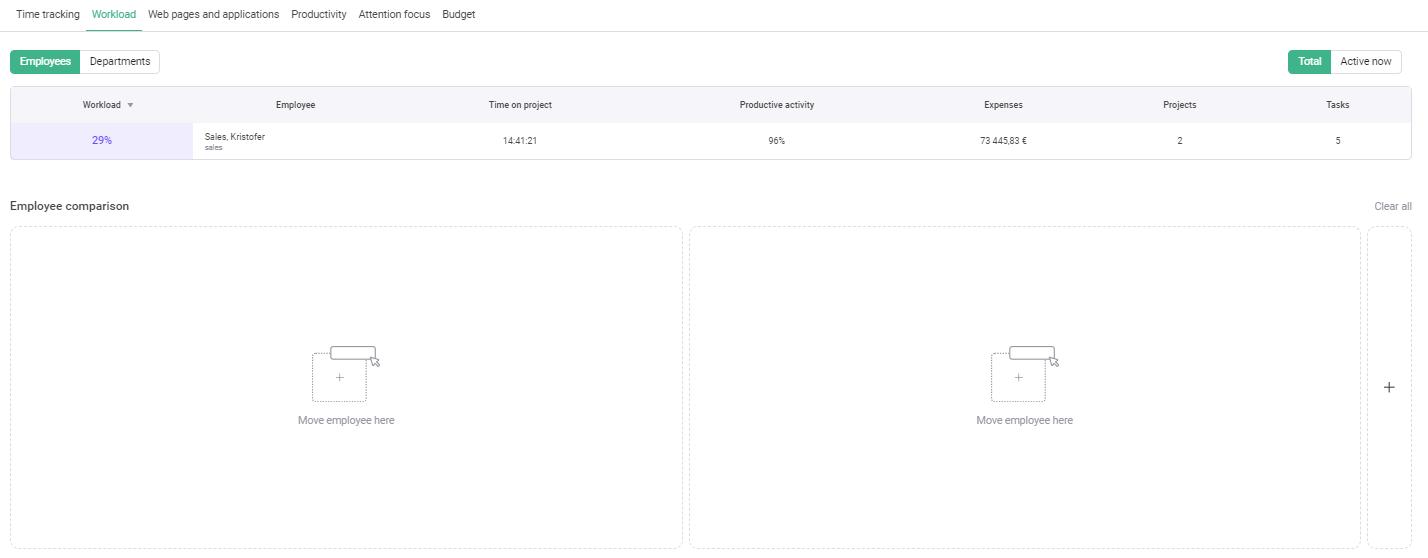
The "Employees" and "Departments" buttons allow you to switch between report types to view data by either employees or entire departments. The "Total" option indicates that the data for the whole time period is displayed, and the "Active now" option allows you to view the current activity of employees.
At the bottom of the report there are pagination elements that allow you to switch between the report pages if the number of employees exceeds one page.
The report on employee workload includes the following metrics:
- Workload
Reflects the workload percentage of each employee - Employee (or Department)
Names and job titles of employees (or department names) involved in projects. - Time on project
The total time each employee or department spent on projects. - Productive Activity
The percentage of productive time spent on a project. - Costs
The amount of costs associated with the activities of each employee or department. - Projects
The number of projects in which an employee or department is involved. - Tasks
The number of tasks assigned to each employee or department.
How to compare employees (or departments):
- Hover the cursor over the row that contains information about an employee or department.
- Click the left mouse button and drag the data into the comparison window.
- To clear the data, click the Clear button in the upper right corner of the window.
- To remove all selected items, click the Clear All button in the upper right corner of the comparison window.
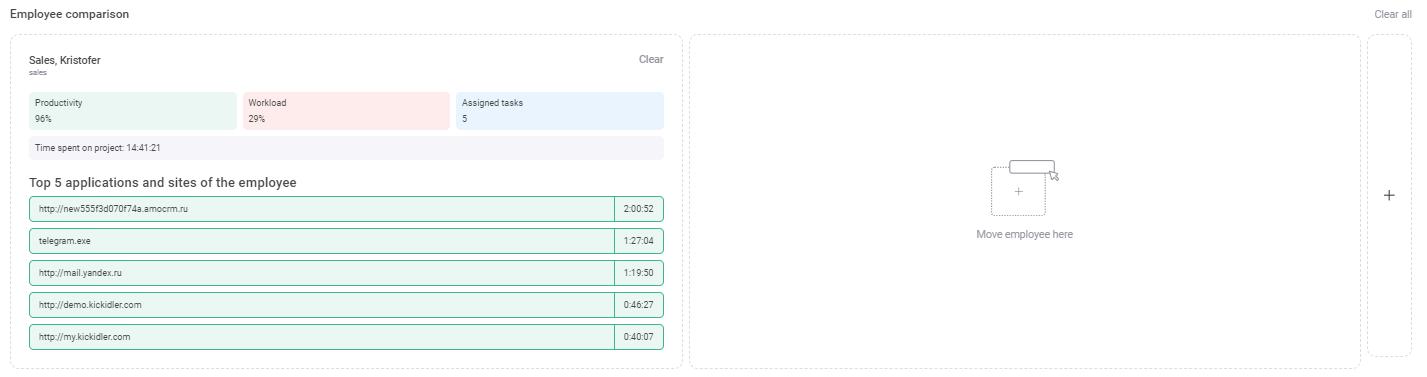
There will be a brief summary of the following parameters in the comparison:
- Productivity
- Workload
- Assigned tasks
- Time spent on the project
- Employee's top 5 applications and sites
Web Pages and Applications
This report shows information on the time spent by employees in certain applications and websites while working on a selected project.
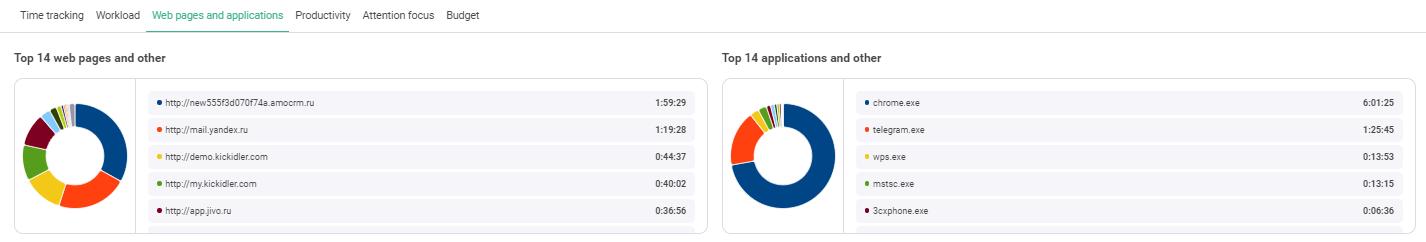
The report consists of two parts:
- Top 14 web pages and other
- Top 14 applications and other
Each section contains a ring chart and a breakdown of the correlation between the two groups in the form of a list of applications or sites and the time spent.
Productivity
This report analyzes employee work time, taking into account the efficiency ratings set for applications. The report is generated in the form of histograms. The histogram can be divided into five sectors:
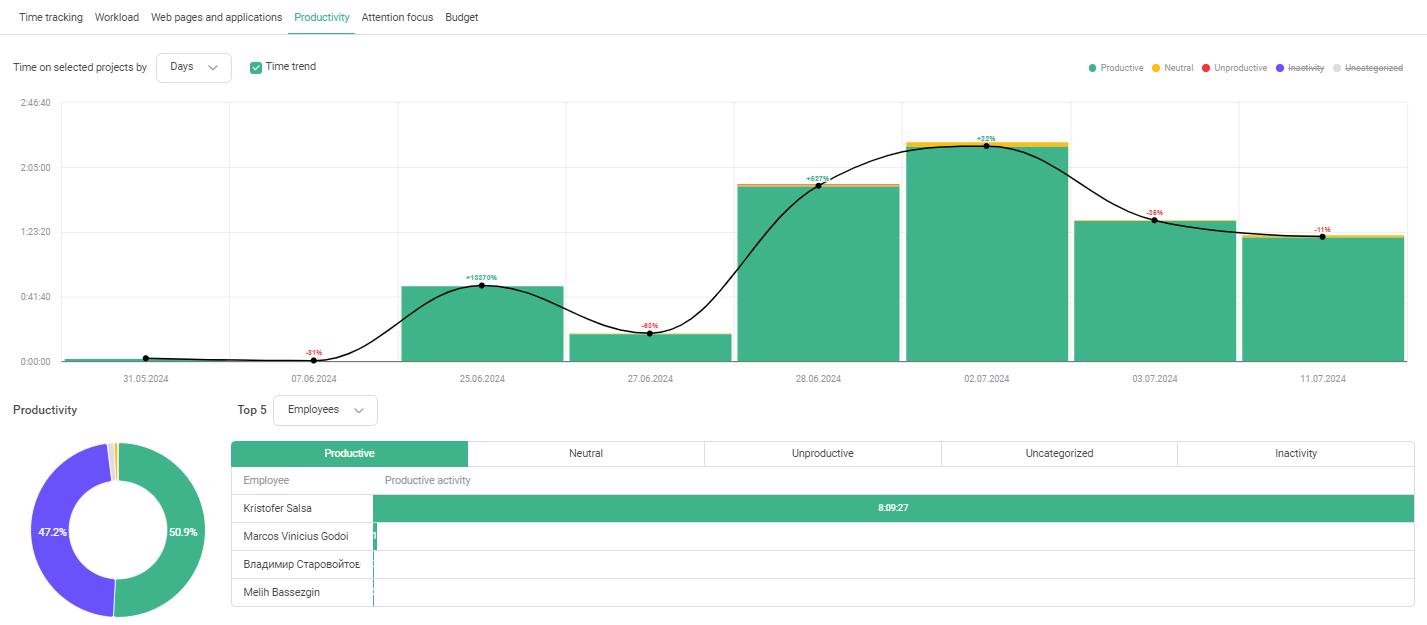
- Productive – time of employee activity in applications that are considered productive; sector color is green.
- Neutral – time of employee activity in applications that are considered neutral; sector color is yellow.
- Unproductive - time of employee activity in applications that are considered unproductive; sector color is red.
- Uncategorized - time of employee activity in applications that have not yet been assessed by the user; sector color is gray.
- Inactivity - time when the user was not active in applications; sector color is purple.
The appearance of a sector in the histogram as well as its size depend on the corresponding time value. For example, if there was no active time in the selected period or in a certain department for applications rated “Unproductive,” there will be no “Unproductive” sector in the histogram.
The size of the histogram is calculated in proportion to the total time it displays.
The graph shows the distribution of activity within the project grouped by the selected period.
The time period can be set in:
- Days
- Weeks
- Months
- Quarters
You can also activate a productivity change trend line for the report.
You can take a detailed look at the productivity of the project for the top 5 employees or departments by switching between tabs with different activity types.
A ring chart to the left of the list shows the distribution of activity types. A legend that explains which color corresponds to each activity type is the same for the chart and the overhead report. All activity types are marked with different colors, which visually indicates their share in the total volume.
Hovering the cursor over a sector of the ring chart pops up a tooltip that shows the total time of activity of this type in the selected project.
Attention Focus
This report shows the distribution of time on different tasks or projects. You can choose to view the report by top 10 projects or top 10 tasks.
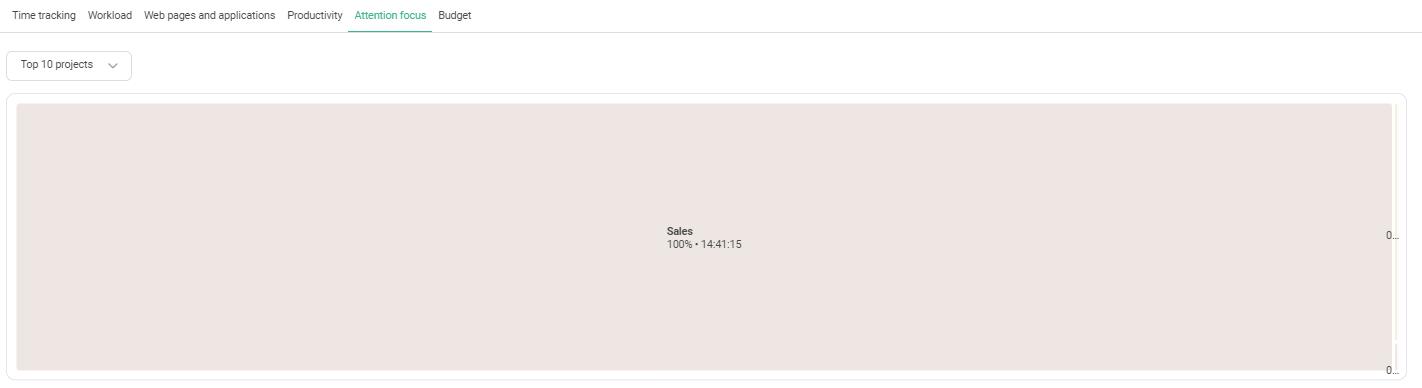
If you select “Top 10 projects,” the report will display the distribution of time by project. This type of report is only available if 10 or more projects are selected for reporting.
Each box will contain:
- Project name
- The proportion of this project among all projects
- Time spent on all tasks in this project
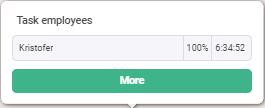
Hovering the cursor over a sector pops up a tooltip that shows the top 3 tasks in this project. Clicking the More button opens a brief summary of all tasks in the project.
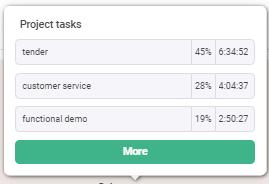
The list of tasks contains the following information:
- Task name
- Percentage of the task in the project.
- Total time spent on the task.
- Task status.
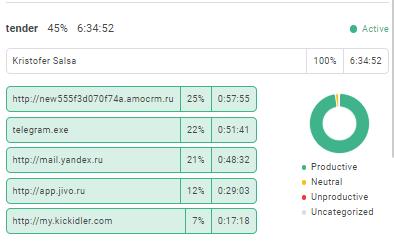
- Employees working on the task.
- Distribution of the work of different employees in percentage of the total time on the task.
- Distribution of the work of different employees by time.
- Top 5 sites and applications used to work on the task.
- Ring chart of activity distribution in the task.
If you select “Top 10 tasks,” the report will display the distribution of time by tasks in the selected projects.
Each bos will contain:
- Task name
- The proportion of this task among all tasks
- Time spent on this task
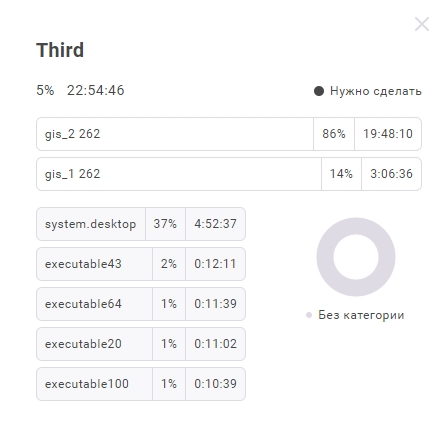
Hovering the cursor over a sector pops up a tooltip that shows the top 3 employees working on this task. Clicking the More button opens a brief summary of the task.
The task summary contains the following information:
- Percentage of the task among the top ones.
- Total time spent on the task.
- Task status.
- Employees working on the task.
- Distribution of the work of different employees in percentage of the total time on the task.
- Distribution of the work of different employees by time.
- Top 5 sites and applications used to work on the task.
- Ring chart of activity distribution in the task.
Budget
This report shows the expenditures or revenues for the selected projects.
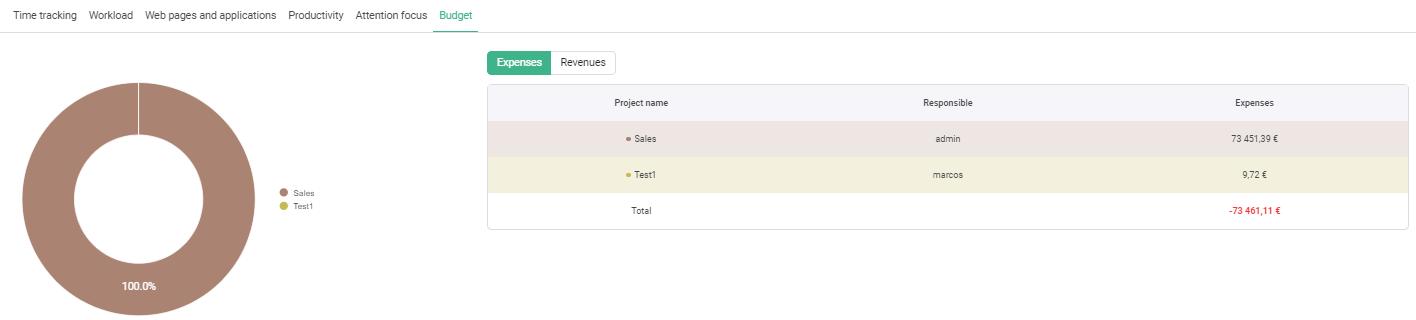
You can view in detail the budget for 5 projects (projects are sorted from the largest amount to the smallest, you can switch between pages using pagination) by switching between the "Expenses" and "Revenues" tabs.
The table shows the following information:
- Project name.
- Person responsible for the project.
- Expenditures or revenues.
- Total line, containing the total amount of expenses or revenues for the selected projects.
The ring chart shows the distribution of the budget among the selected projects. A legend to the right of it shows the color of each project to visualize their share of the total. Hovering the cursor over a sector of the ring chart pops up a tooltip that shows the total expenses or revenues for the selected project.
Creating a new project
In create a new project, click the Create Project button.
It is possible to create two types of projects:
- Without deadline
- With deadline
To create a project without a deadline
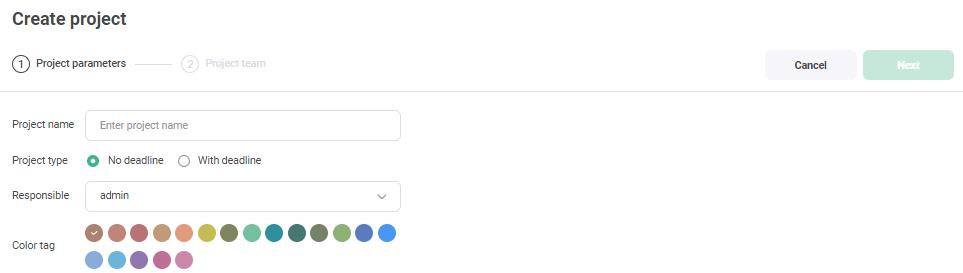
Set the project parameters:
- Enter a name for the project
- Select the project type - no deadline
- Assign a person to be responsible for the project by selecting a person from the drop-down list
- Select a color tag
- Click on the "Next" button
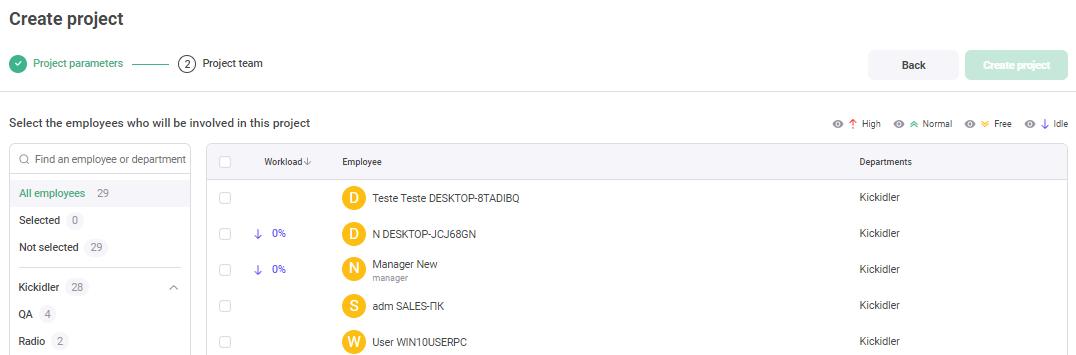
After that, the project team needs to be created:
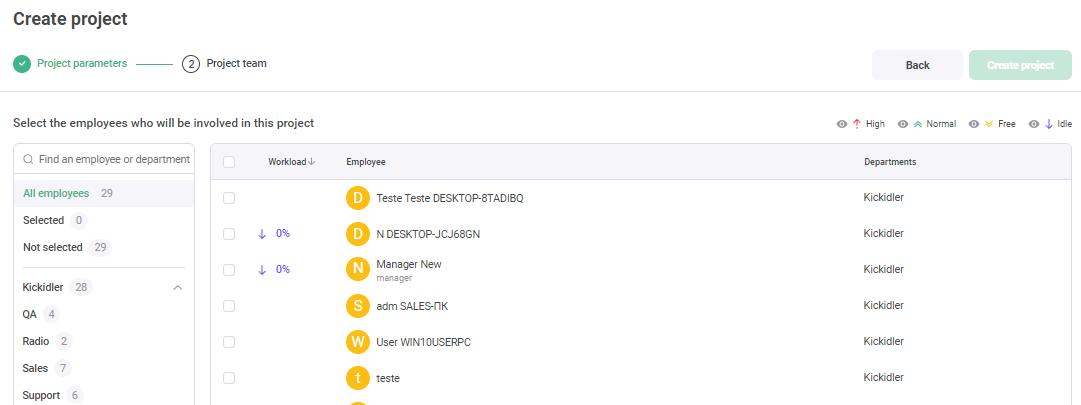
- Select the project team from the list of employees using the checkboxes. The project must have at least one employee at the time of creation.
You can use the Search field. Enter the name of an employee or department to quickly find the required people or filter employees by category or department.
The employee list reflects the following information:- Workload - the employee's current workload level (e.g., 49%)
- Name of the employee that can be selected for the task
- Name of the department the employee works in
- Click the "Back" button to return to the previous configuration step
- click the "Create Project" button
To create a project with a deadline
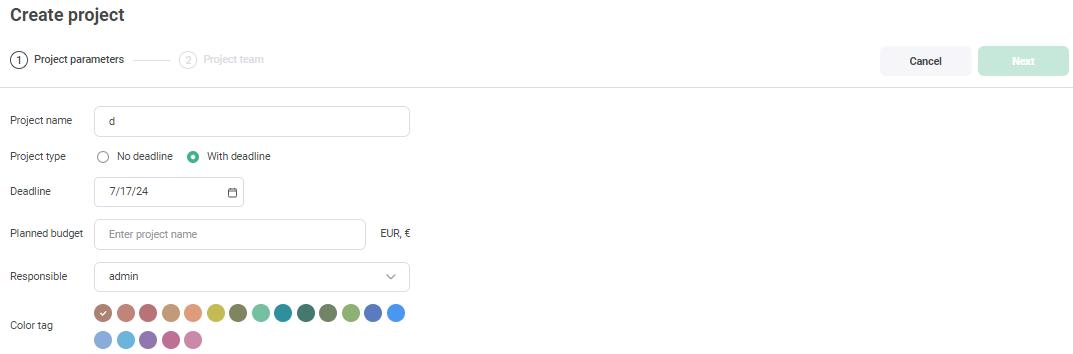
Set the project parameters:
- Enter the project name
- Select the project type – with deadline
- Set the deadline date by selecting it in the calendar
- Enter the target budget
- Assign a person to be responsible for the project by selecting an employee from the drop-down list
- Select a color tag
- Click on the "Next" button
After that, the project team needs to be created:
- Select the project team from the list of employees using the checkboxes. The project must have at least one employee at the time of creation.
You can use the Search field. Enter the name of an employee or department to quickly find the required people or filter employees by category or department.
The employee list reflects the following information:- Workload - the employee's current workload level (e.g., 49%)
- Name of the employee that can be selected for the task
- Name of the department the employee works in
- Click on the "Back" button to return to the previous configuration step
- Click on the "Create Project" button
Project page
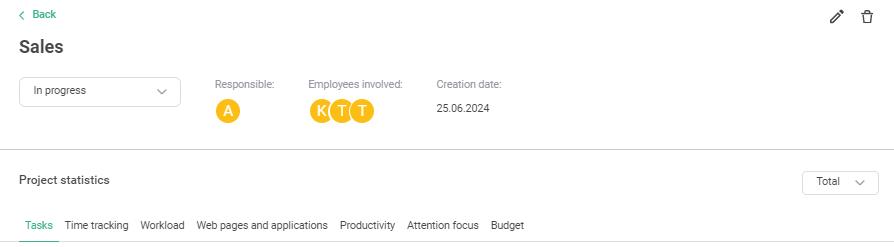
Each project has its own page. It contains:
- Main information
- Project statistics
The main information section contains:
- Project name
- Project status
The project can be:- In Progress
- On Pause
- Archived
- Person responsible for the project
- Number of employees involved
- Date of creation
- Edit project button
- Delete project button
The project statistics section contains a kanban board with tasks and reports:
- Time tracking
- Workload
- Web pages and applications
- Productivity
- Attention focus
- Budget
Task board
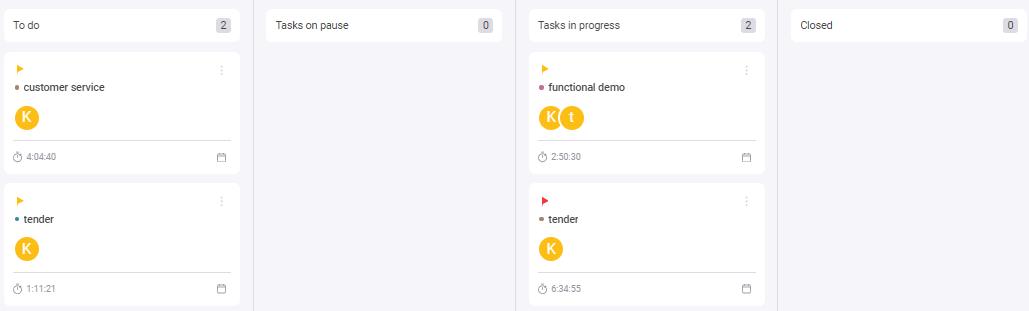
The task board contains all created tasks that are relevant to this project.
Tasks can be displayed in four different statuses:
- To do
These tasks include created tasks that have not yet been started. - Tasks on pause
These tasks are the ones that do not have enough data to complete or the ones that have been postponed.
A task with this status is not displayed on the employee's page. - Tasks in progress
These tasks are the ones that the employee is currently working on. - Closed
These tasks include completed tasks.
A task with this status is not displayed on the employee's page.
The task card contains brief information about the task:
- Task priority
- Color label
- Task name
- Task progress (if the task has a deadline)
- List of employees involved
Actions with an already created task:
- View
- Edit
- Delete
To locate a task on the board
- Start typing the name of the task in the Find Task box
- The tasks on the board will be filtered by name
To create a new task
Click on the "Create Task" button, and you will be redirected to the task creation page.
The interface consists of two steps: "Task Parameters" and "Task Team".
Task Parameters
- Enter a name for the task
- Select the type of task
- Without deadline: select if the task does not have a specific deadline
- With Deadline: select if the task has a specific deadline.
- If you selected the “With Deadline” task type, enter the deadline date using the text box or calendar
- Select a priority
- High (red label)
- Medium (yellow label)
- Low (blue label)
- Set the current status of the task:
- To do
- In progress
- Paused
- Closed
- Select a color label to visually identify the task. This helps you quickly identify tasks by color.
- Describe the task in the corresponding text box, providing all the necessary information to complete the task.
- Click the Cancel button if you want to undo the creation of the task
- Click the Next button to proceed to the next step, "Task Team".
Task Team
- Select an executor from the list of employees using the checkboxes - the task must have at least one executor at the moment of its creation.
You can use the Search field. Enter the name of an employee or department to quickly find the required people or filter employees by category or department. - Click the Back button if you want to return to the previous stage of task settings customization
- Click the Create task button to finish creating the task with the selected parameters and team of employees.
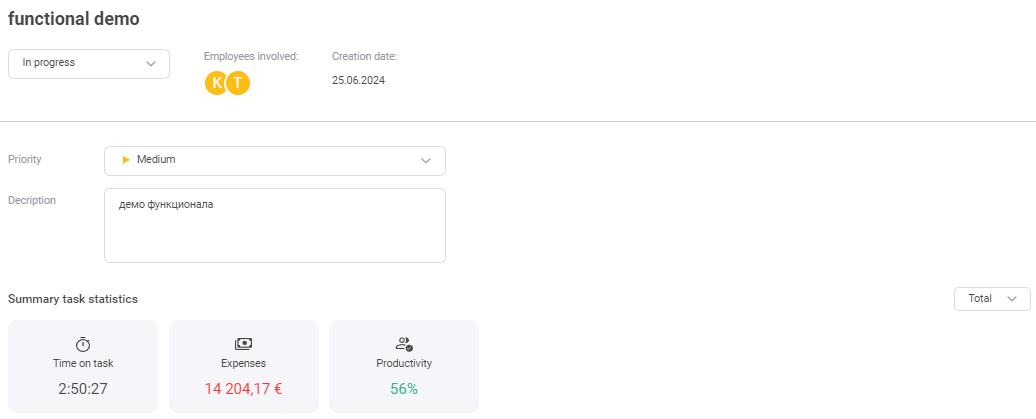
Task Card
The task card collects all necessary information in one place: task name, description, deadlines, priority, employees involved, etc.
The top panel in the task card contains control buttons:
- Back – to return to the previous screen of the task list.
- Edit – to open the task creation window.
- Delete – to delete the task card.
Main information:
- Task name
- Task status
- Employees involved - list of employees
- Date of task creation
- Deadline (if specified)
- Priority
- Description – text field for a detailed description of the task
Task summary statistics contain:
- Date – drop-down list for selecting the time period for displaying statistics
- Time on task – time spent on task execution
- Costs –expenses related to the task
- Productivity – productivity of the task
Employees on task & top web pages and applications
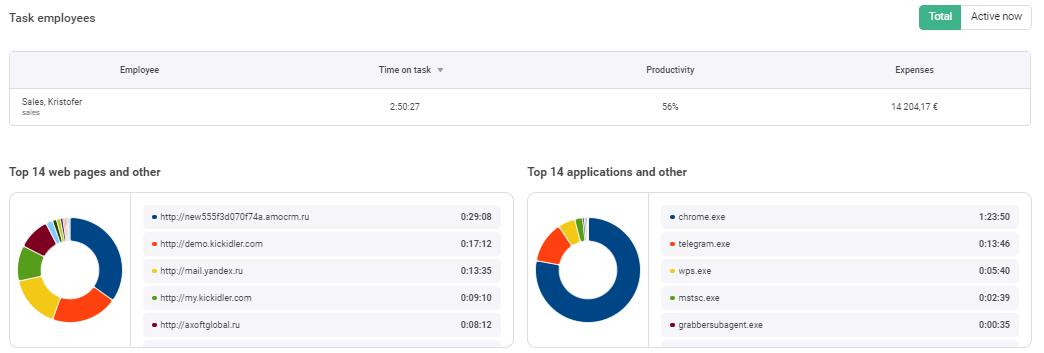
This section contains information about the employees involved in the task, as well as how they distribute their time and resources.
The "Total" and "Active Now" buttons allow you to switch between the data for the entire period of task execution and the currently active employees.
The table of employees on the task contains the following columns:
- Employee – name and role of the employee
- Time on task – total time spent by the employee on task execution
- Productivity – the employee's productivity rate
- Costs – costs associated with the employee's work on the task
Graphs and statistics of usage display the distribution of time spent by employees on certain sites or in applications. It is comprised of two different units.
- Top 14 web pages and other
- Top 14 applications and other